
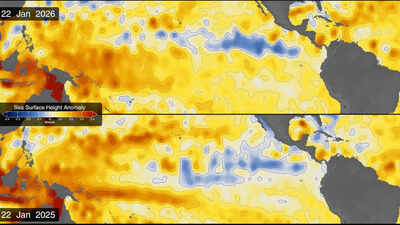
While climate change is tracked carefully by scientists all around the world, there are some periodic phenomena also warrant their attention. El Niño is one such event that affects global weather patterns, impacting rainfall, ocean temperatures, and wind patterns. These factors, therefore, affect weather-dependent human activities such as agriculture and fishing. During the current El Niño event, the Pacific Ocean is sending out a warning, and this time, scientists are watching it from space. Vast stretches of the ocean are warming, sea levels are rising in unusual patterns, and satellite images are revealing something that looks remarkably familiar.NASA’s latest maps show a similarity between the developing 2026 El Niño and the powerful event of October 1997, one of the strongest El Niño episodes ever recorded. The event was significant because of the estimated $5.7 trillion in global economic losses that followed over the years. With comparisons being made between the two events, there is growing concern that the 2026 phenomenon could become even more powerful. NASA oceanographer Josh Willis has suggested that the current event is on track to surpass the 1997 episode.
What exactly is happening beneath the Pacific?
During an El Niño, upwelling weakens, and the surface of the central and eastern tropical Pacific ends up warmer than usual. The phenomenon returns naturally every two to seven years, but no two events are alike in strength or consequences. The shifts in ocean temperature ripple outward, affecting rainfall, winds and storms worldwide.In January 2026, satellites picked up one of the earliest signs of what was coming: a swell of warm water, known as a Kelvin wave, drifting near Micronesia in the western Pacific. These waves are slow-moving pulses of water that can stretch thousands of miles, and carry heat from west to east across the ocean. As the warm water heats the air above it, that air rises, and the resulting shift in pressure weakens or even reverses the trade winds that normally blow from the Americas toward Asia.With the winds easing, sea levels in the eastern Pacific climb higher and the water warms further, setting off a chain reaction that marks the beginning of an El Niño. By early April, those waves had reached the eastern Pacific and surface temperatures there had begun to rise. Because warm water expands, local sea levels in some areas swelled by as much as 1 to 1.3 feet (30 to 40 centimeters), and the raised water could be seen sloshing toward South America and up the coast to California. On the opposite side of the ocean, around Indonesia and northern Australia, sea levels dropped six to eight inches (15 to 20 centimeters) below normal.Scientists at NASA are using satellite altimetry, a technique that measures tiny changes in ocean-surface height, to understand how the phenomenon is developing this time. Since warmer seawater expands, unusually high sea levels can indicate where heat is accumulating beneath the surface.
Why NASA’s October 2026 maps look so familiar
When NASA put satellite data from 1997 and 2026 side by side, researchers took notice. Both maps show unusually high sea levels stretching across the central and eastern equatorial Pacific toward South America.The earlier measurements came from the TOPEX/Poseidon satellite, while the latest observations were recorded by the Sentinel-6 Michael Freilich satellite. The comparison is possible because NASA has access to approximately 35 years of satellite observations, collected by successive missions following almost identical paths around the planet.The maps use shades of red to indicate higher-than-average sea levels, blue for lower-than-average levels and white for conditions closer to normal. Scientists have also removed seasonal variations and long-term trends to make the temporary changes associated with El Niño easier to identify.According to NASA oceanographer Josh Willis, the current event developed much more suddenly than the 1997 phenomenon. Yet, despite the difference in timing, the two events have begun displaying similar ocean patterns. Willis, who works on sea-level missions at NASA’s Jet Propulsion Laboratory, believes the developing event is currently on track to become even bigger than its 1997 counterpart.
What could the 2026 El Niño mean for the rest of the world?
The concern is not limited to the Pacific. El Niño can influence weather patterns across much of the planet, although its effects are different from one region to another. As observed in previous El Niño events, diverging from normal patterns, some areas may experience unusually heavy rainfall and flooding, while others could face prolonged dry spells, heatwaves and agricultural difficulties.
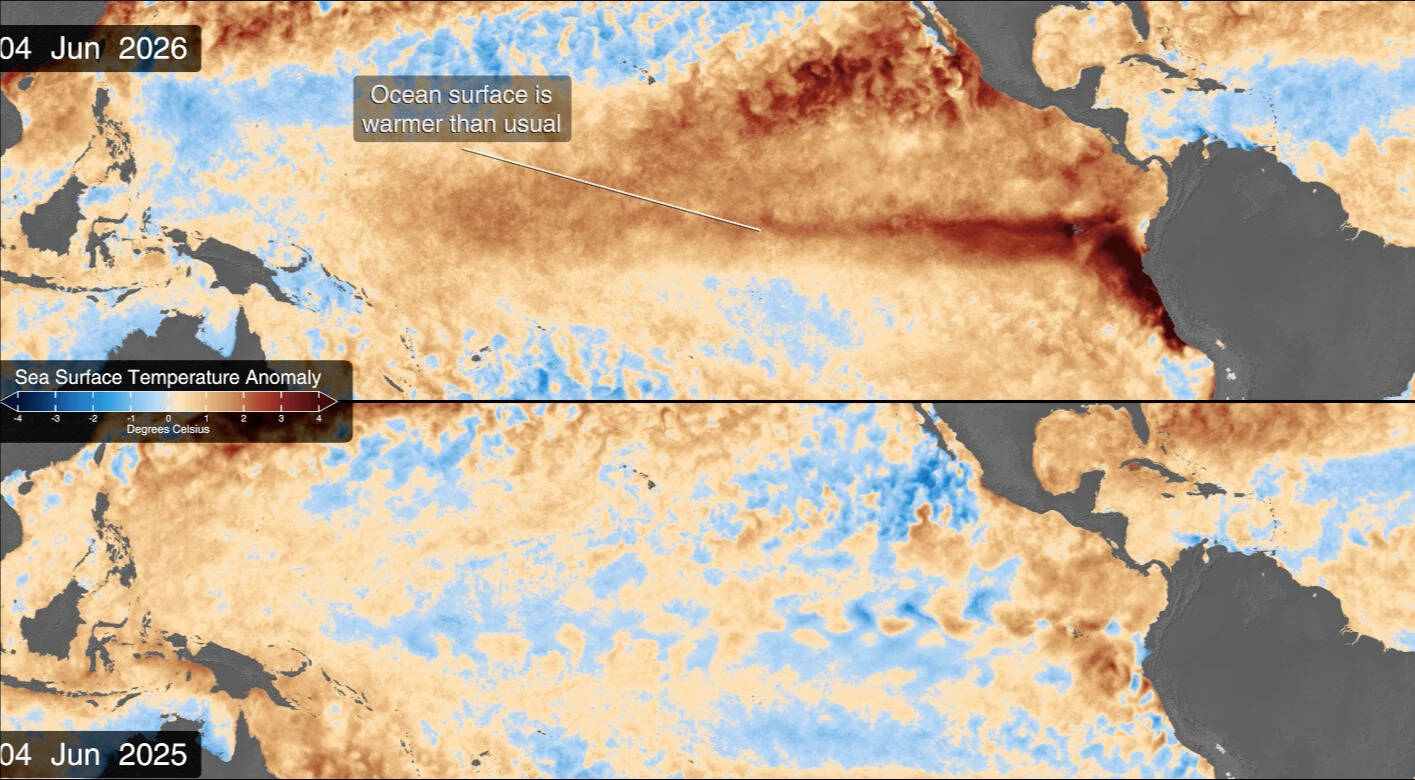
The map above compares sea surface temperatures in 2025 (a weak La Niña year) and 2026. (Image Credit: NASA’s Scientific Visualization Studio/ via NASA)
El Niño is often associated with weaker monsoon rainfall, making it crucial to track for countries such as India. The irregularities in monsoon threaten an additional pressure on already stressed sectors of agriculture, water availability and rural livelihoods. That said, a strong El Niño doesn’t automatically mean a weak or failed monsoon. Other ocean and atmospheric factors also shape how it behaves, so every year turns out differently.NOAA’s October outlook puts the chance of strong to very strong El Niño conditions in the first three months of 2027 at 83%. That raises the prospect of significant weather disruption this winter and beyond.